

If you manage an aerospace supply base, you likely already have a supplier scorecard. The question is whether that scorecard functions as a strategic program risk instrument or an administrative reporting burden. In aerospace, a nonconforming part can trigger a safety-of-flight event, a government notification or a stop-ship order that halts production across multiple programs.
A well-designed aerospace supplier scorecard quantifies risk using principles similar to those that major OEMs apply to their own supply bases. It establishes objective thresholds that trigger consistent action, layers review cadence to risk level and serves as the foundation for every sourcing decision. When built correctly, supplier scorecards become forward-looking risk management tools.
What Should be Included in a Supplier Scorecard?
Metric selection is foundational because it aligns measurement with aerospace-specific risks. The scorecard should include metrics that reflect your true aerospace program risk. A comprehensive framework includes four critical categories:
- Quality: Opt for essential quality metrics that give you visibility into quality systems and the ability to catch issues before shipment. Include nonconformance rate with severity multipliers for escapes versus in-house catches, Supplier Corrective Action Request (SCAR) and Corrective Action Request (CAR) open and close rates, Material Review Board activity, and receiving rejection rate.
- Delivery: Measure both historical and future performance. Track on-time delivery at the lot and line-item level, overdue quantities, and forward-looking schedule commitment accuracy. Major OEMs track future commitment accuracy as a key leading indicator. It reveals whether suppliers can reliably forecast their own production capability.
- Responsiveness: An often underweighted category that serves as a critical early warning signal. Include SCAR and CAR response time, on-time corrective action closure rate, and root cause submission timeliness. A slow response reflects a systemic issue within the quality organization.
- Compliance: Track AS9100 certification status, number of open audit findings, Production Part Approval Process and first article completion rates, and export control compliance. A lapsed certification fundamentally changes the risk profile of every open purchase order.
Weighting Your Scorecard
Weighting encodes your organization’s priorities and risk tolerance into the final score. The 60/40 split — 60% quality, 40% delivery — is a good standard to follow.
The Asymmetry of Quality vs. Delivery Failures
The 60/40 weighting encodes risk into the calculation. A nonconforming part can cause a catastrophic safety event, trigger government notification requirements, or result in a stop-ship order that halts production across multiple programs. A delivery miss causes a schedule disruption or a line-down event. The weighting acknowledges this difference, preventing quality failures from being masked by strong delivery performance.
Applying Criticality-Adjusted Weighting
The base 60/40 formula should be adjusted based on component criticality. Sole-source suppliers of flight-critical forgings carry a different risk profile than commodity fastener suppliers with multiple alternates.
Apply part-level or commodity-level multipliers to the base formula to reflect this reality. A critical mistake occurs when scorecards show green overall while failing quality. Various customer benchmarks will display quality and delivery ratings separately before combining them, ensuring visibility into performance by category before the weighted score masks underlying issues.
Threshold Design
A score or color is useless if it does not trigger a standardized action. The goal of thresholds is to drive consistent behavior from the program management team. A typical three-tier system establishes clear expectations:
- Green (95-100): Meeting or exceeding expectations. They remain on a standard monitoring cadence and are eligible for new business awards. Green status signals that current controls are effective and no intervention is required.
- Yellow (80-94): Conditional performance. Yellow status must automatically trigger a documented corrective action plan with milestones, increased review frequency, and a flag on any new business awards for additional review. This threshold indicates the risk of becoming unsatisfactory without intervention.
- Red (<80): Unsatisfactory performance. Red status must trigger formal supplier development engagement, the potential deployment of on-site representatives, a formal sourcing review, and a pause on all new business. This threshold indicates active program risk that requires immediate corrective action.
Establish a Review Cadence
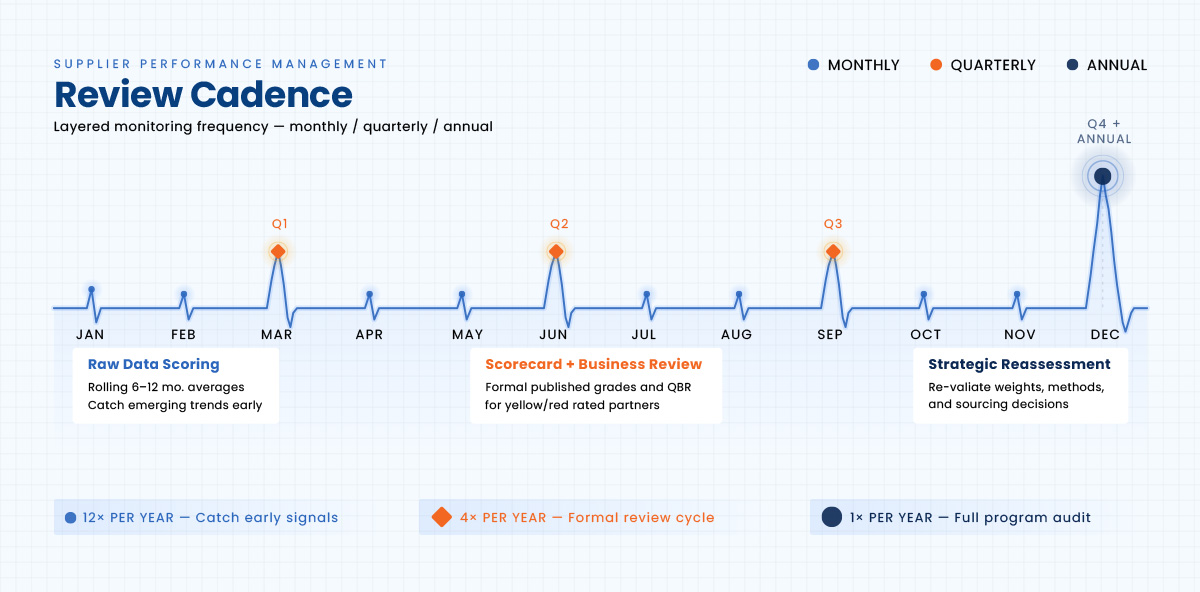
An effective program layers its review frequency to focus bandwidth on the highest-risk sources. A one-size-fits-all cadence wastes resources on low-risk partners while under-monitoring at-risk sources who need closer oversight.
1. Monthly Raw Data Scoring
Monthly refreshes of raw performance data allow the system to catch emerging negative trends early. Most programs calculate these scores on a rolling six-month or 12-month average to smooth short-term volatility while maintaining sensitivity to performance shifts. Monthly scoring offers internal visibility before the official quarterly release and enables proactive engagement with sources trending toward yellow or red status.
2. Quarterly Scorecard Publication and Business Reviews
Quarterly releases are standard for most large primes, including Northrop Grumman. Each quarter represents the formal grade published to sources and serves as the basis for performance discussions. For at-risk partners in yellow or red status, pair each release with a formal quarterly business review to assess corrective action plans, evaluate progress against milestones, and determine whether additional intervention is required.
3. Annual Program Reassessment
The annual strategic review reassesses the entire supply base. Use this time to re-validate weighting, review sourcing decisions, and identify green-rated partners trending toward yellow before they cross the threshold. Annual reviews also create opportunities to adjust the scorecard methodology based on lessons learned and changing program priorities.
Using Scorecard Data for Strategic Sourcing Decisions
Past performance data is the most reliable predictor of future risk and should be a primary input for all sourcing decisions. The supplier selection process should always include a review of historical scorecard performance.
New Source Selection
Historical scorecard performance offers objective and defensible criteria for source selection. Chronic Material Review Board history or slow SCAR closure rates are predictive indicators of future performance. Using scorecard data in new source selection prevents awards based on price alone and ensures program risk factors are considered in the decision.
Sole-Source Risk Management
When sole-source partners trend toward yellow status, programs face major risk. The scorecard data creates an objective trigger to begin proactive investment in development or to initiate a dual-source qualification program before the rating goes red. Waiting until a sole-source partner reaches red status leaves the program with no good options.
Supply Base Rationalization
When consolidating the supply base, scorecard data offers objective criteria for choosing which partners to retain and which to exit. Data-driven rationalization is critical for internal alignment and for defending sourcing decisions if audited. This approach guarantees that consolidation decisions are based on demonstrated performance rather than subjective assessments.

Turn Data Into Action With Unitek Technical Services
Building an effective aerospace supplier scorecard requires selecting the right metrics, applying industry-standard weighting and establishing thresholds that drive action. The result is a strategic tool that quantifies risk and enables proactive performance management across your supply base.
Unitek Technical Services delivers the expert teams who translate scorecard insights into measurable improvements on the factory floor. Our supplier development programs and resident quality representatives work on-site with at-risk partners to address root causes, close corrective actions and verify compliance with your specifications. With over 50 years of experience supporting aerospace OEMs, we help you mitigate risk before it impacts production schedules.
Contact us to discuss your needs.